> ## Documentation Index
> Fetch the complete documentation index at: https://zuperinc-section23.mintlify.site/llms.txt
> Use this file to discover all available pages before exploring further.
# Summary Report
A **Summary Report** in Zuper, similar to a pivot table, provides a high-level overview of data by grouping information based on specific fields such as status, type, or category. This report type is useful for analyzing trends, identifying anomalies, and gaining insights into data patterns across various dimensions.
Summary Reports include row groups, column groups, and aggregation to structure and simplify data presentation. The field selection process for row and column groups works similarly to that of a Detailed Report. If you select fields from a primary module, you can further enhance your report by including relevant fields from additional modules.
A key feature of Summary Reports is aggregation, which allows data to be grouped and summarized into meaningful values. For example, a Summary Report can group jobs by status (e.g., *Open*, *In Progress*, *Completed*) and display the total number of jobs per status using the Count function.
In this article, you will learn how to create a Summary Report in Zuper, including selecting modules, organizing data fields, and applying aggregation functions to generate meaningful insights.
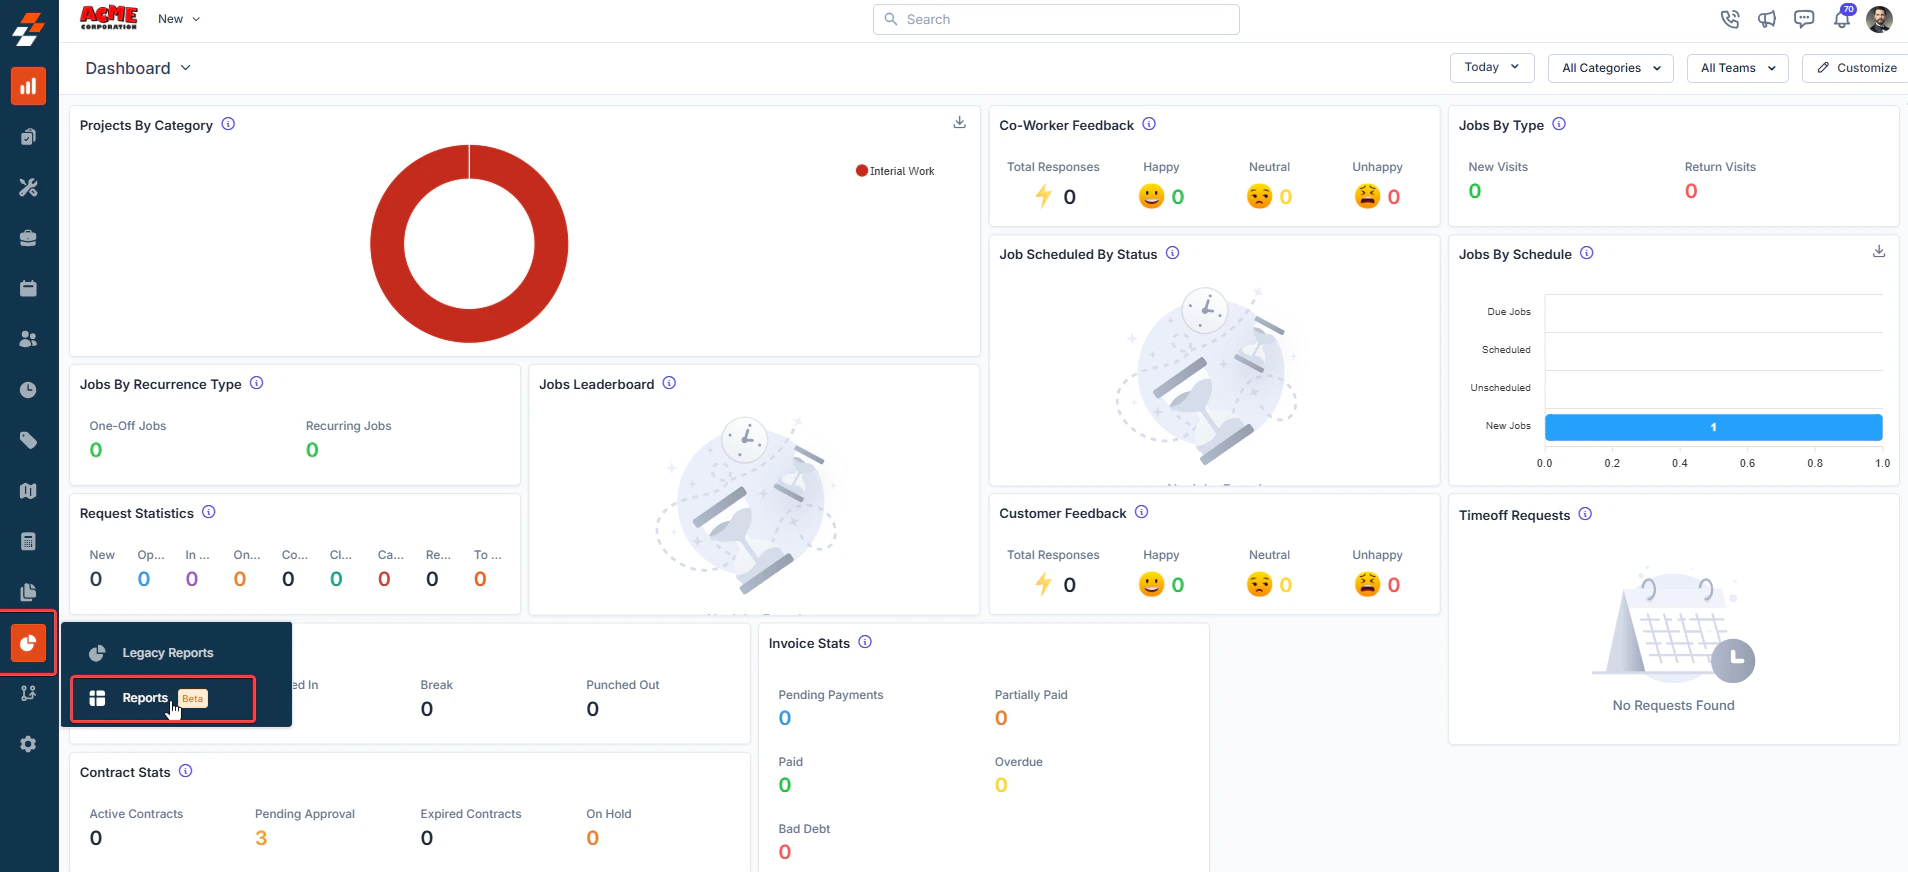
1. Click the “**Reports**” module from the left navigation menu and select "**Reports**" (beta). This will direct you to the **Reports** builder home page, where you can view all previously created reports.
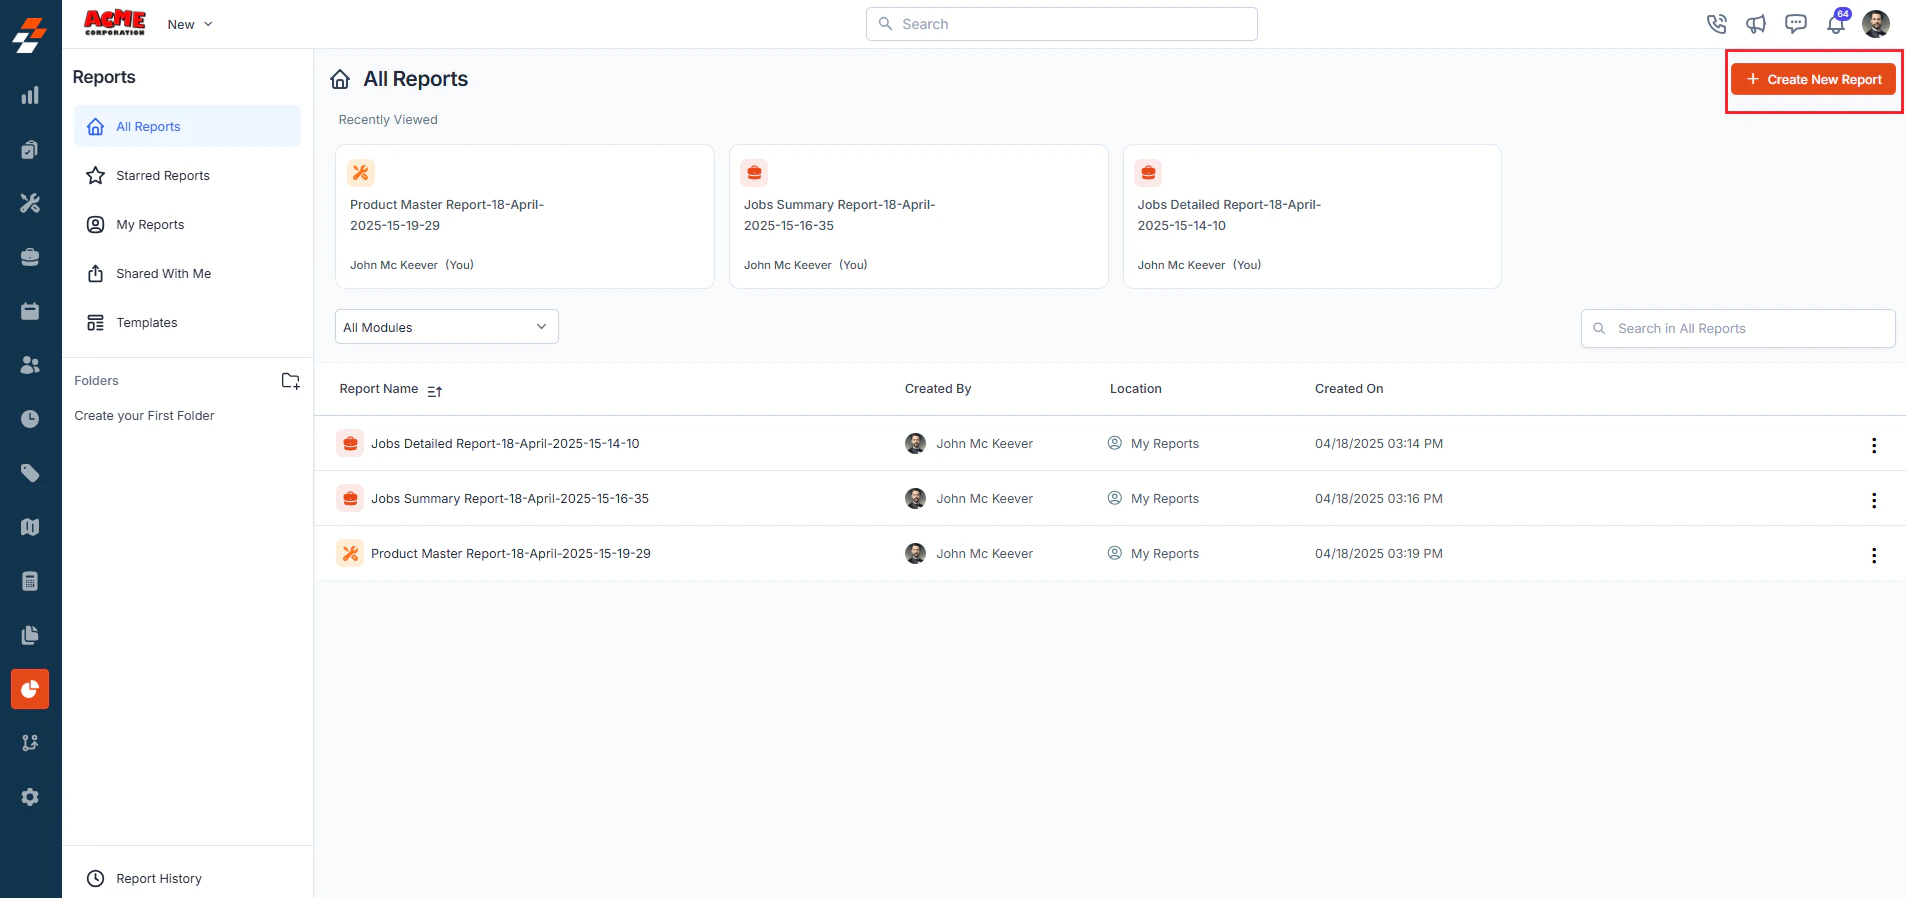
 2. Click the **+ Create New Report** button in the top-right corner of the Reports home page.
 3. A pop-up will appear. Choose **Summary Report** from the available options.
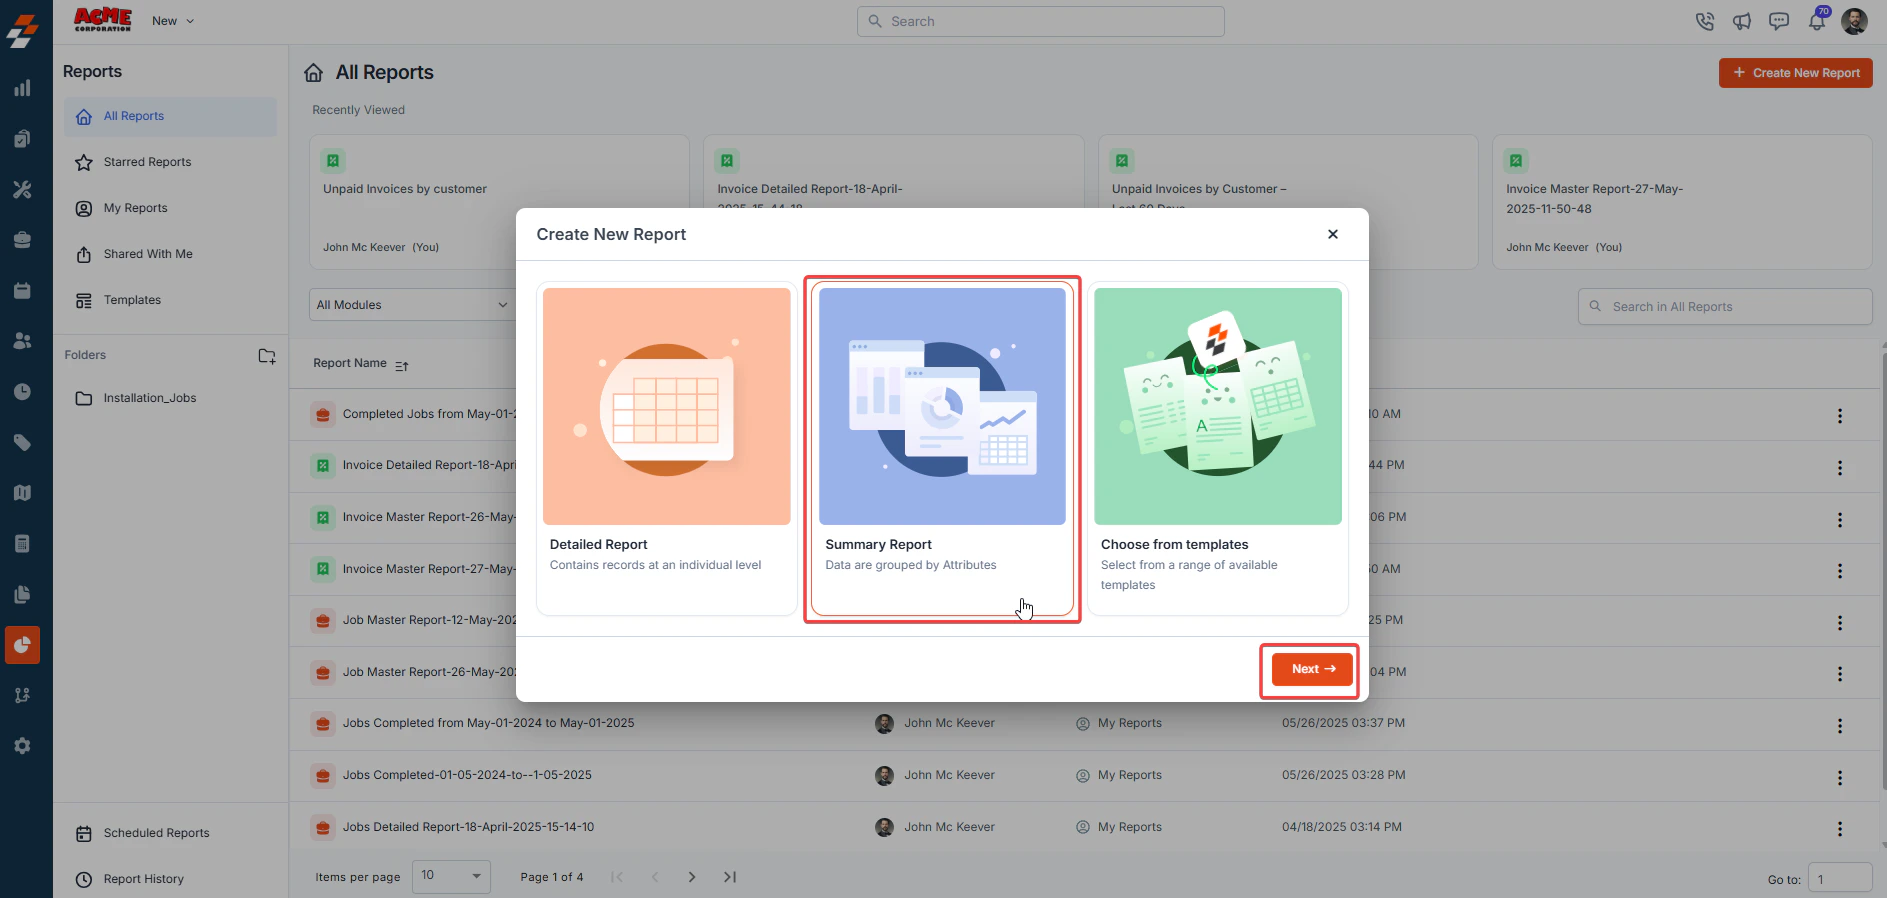 4. Click **Next** to proceed.
5. After selecting the **Summary Report**, you will be prompted to choose the **Primary Module** on which you want to focus your report (e.g., Jobs) and click **Next**.
4. Click **Next** to proceed.
5. After selecting the **Summary Report**, you will be prompted to choose the **Primary Module** on which you want to focus your report (e.g., Jobs) and click **Next**.
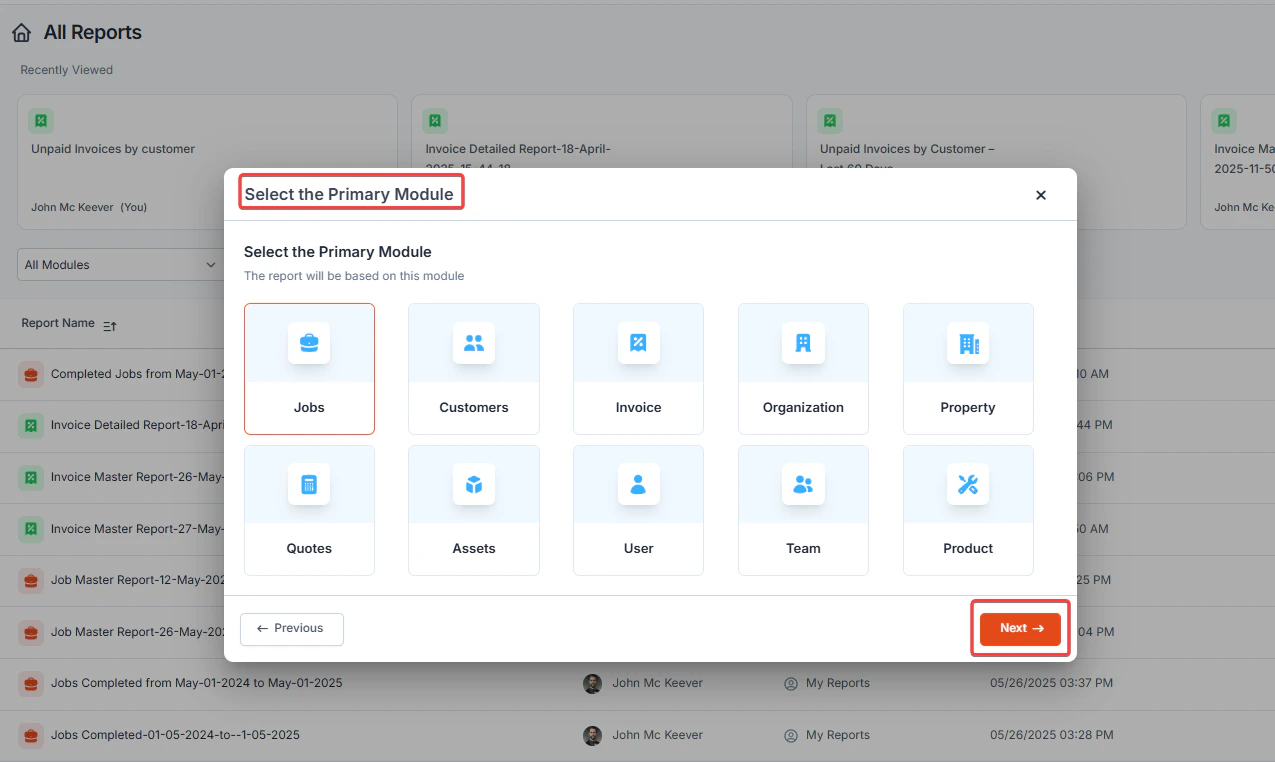 **Note:** The primary module determines the main data source that will be included in the report.
7. Select the additional modules you need. You can select up to 3 additional modules. Zuper allows you to pull in data from **Additional Modules** associated with your primary module. This step helps you to create comprehensive reports by combining related field information from key modules.
**Note:** The primary module determines the main data source that will be included in the report.
7. Select the additional modules you need. You can select up to 3 additional modules. Zuper allows you to pull in data from **Additional Modules** associated with your primary module. This step helps you to create comprehensive reports by combining related field information from key modules.
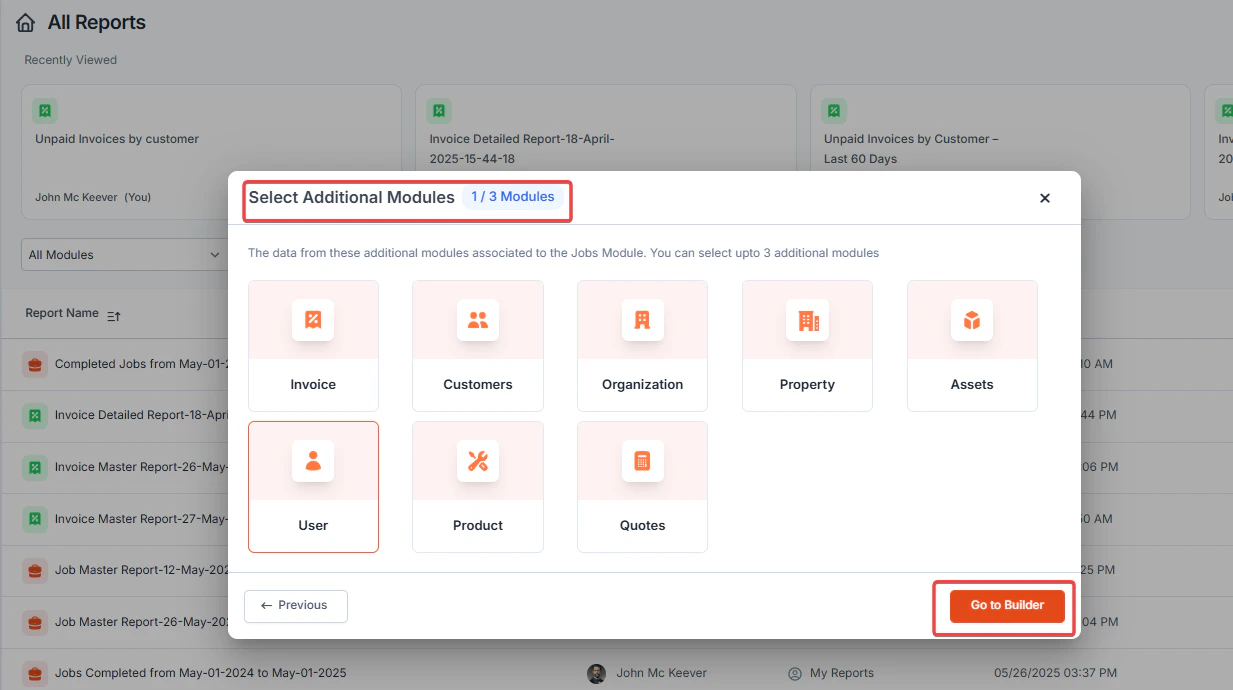 8. Click **Go to Builder**.
9. Once the report creation page opens, you can start defining the fields to be included in the report.
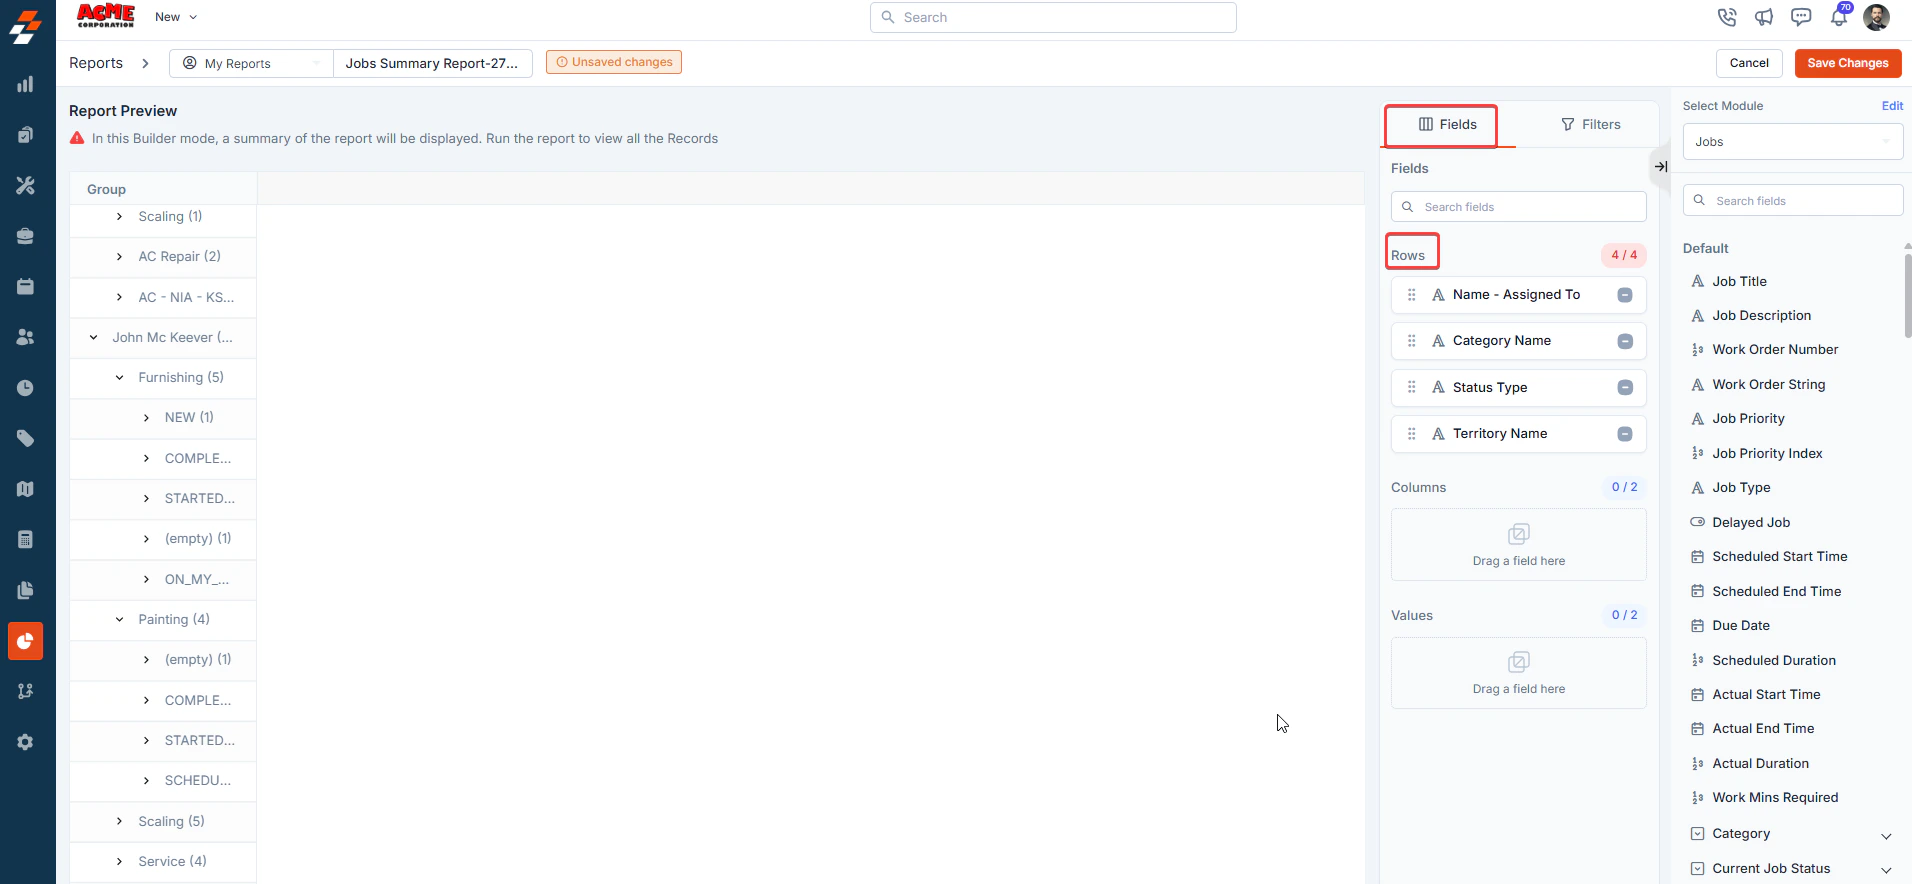
10. Select fields for the row and column to group. Summary reports have three components:
**Row**: Define how data is categorized or grouped (e.g., **Job Status, Customer Name, Service Type**). For example, if grouped by **Job Status**, the report will list categories like **Open, In Progress, and Completed** as separate rows. You can group up to 4 rows.
8. Click **Go to Builder**.
9. Once the report creation page opens, you can start defining the fields to be included in the report.
10. Select fields for the row and column to group. Summary reports have three components:
**Row**: Define how data is categorized or grouped (e.g., **Job Status, Customer Name, Service Type**). For example, if grouped by **Job Status**, the report will list categories like **Open, In Progress, and Completed** as separate rows. You can group up to 4 rows.
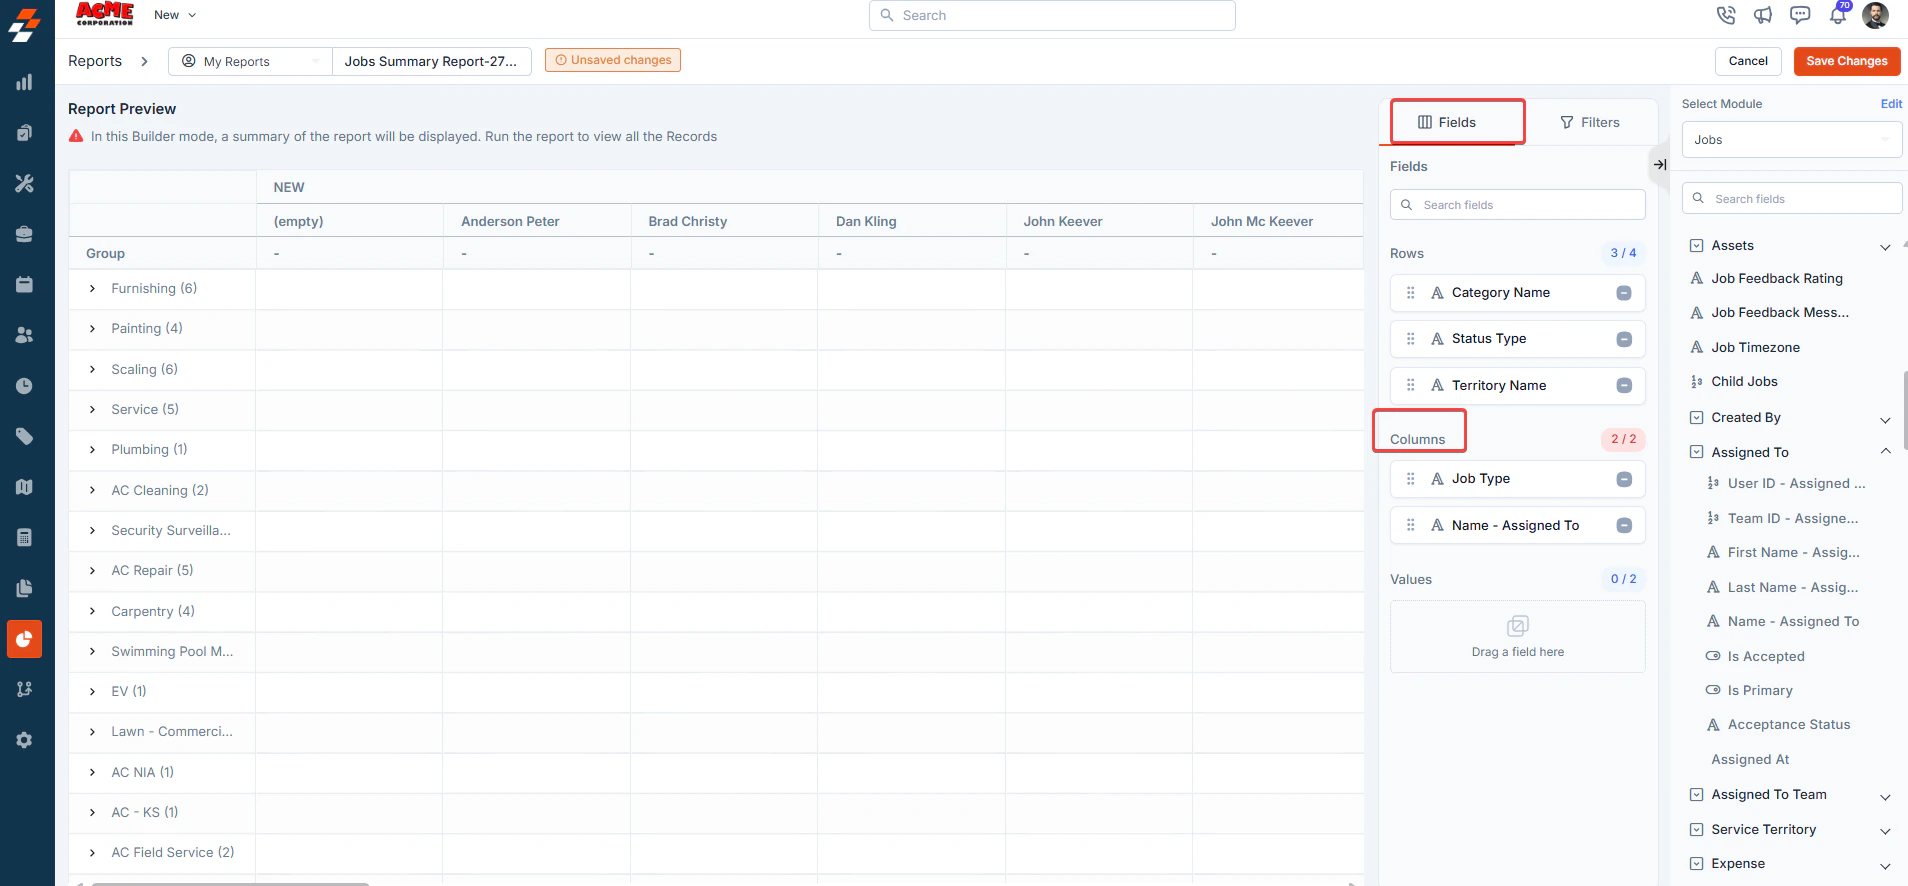
 **Columns**: Segment the grouped data into additional columns (e.g., Assigned Technician, Region, Service Type).
For example, if a job is grouped by **Status**, column groups could show **each technician’s name** under that status. A maximum of 2 columns can be added.
**Columns**: Segment the grouped data into additional columns (e.g., Assigned Technician, Region, Service Type).
For example, if a job is grouped by **Status**, column groups could show **each technician’s name** under that status. A maximum of 2 columns can be added.
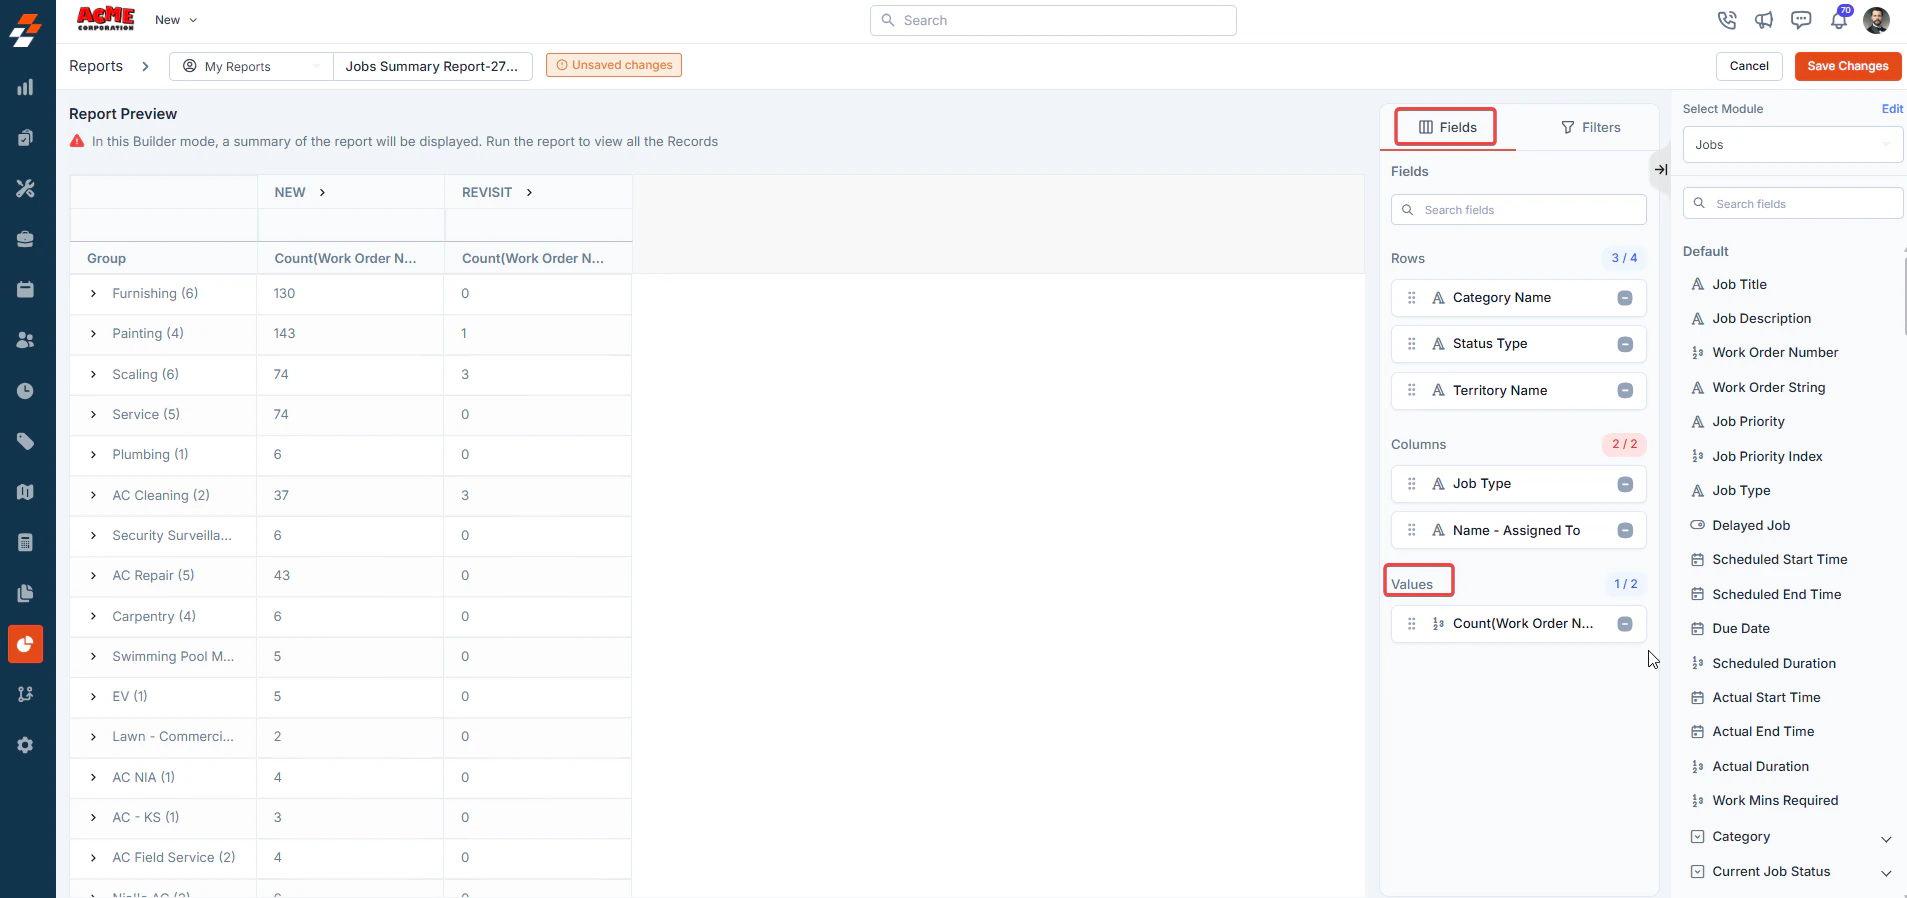
 **Value**: Refers to the field that you try to aggregate. A maximum of **2 value fields** can be added.
 **Note:** You can reselect the modules by clicking the **Edit** button. However, updating the modules will reset the report.
11. You can rename column names and customize how each column behaves within the report. To know more, see [Configure Report Settings](/Reports/Detailed_report#configure-report-settings).
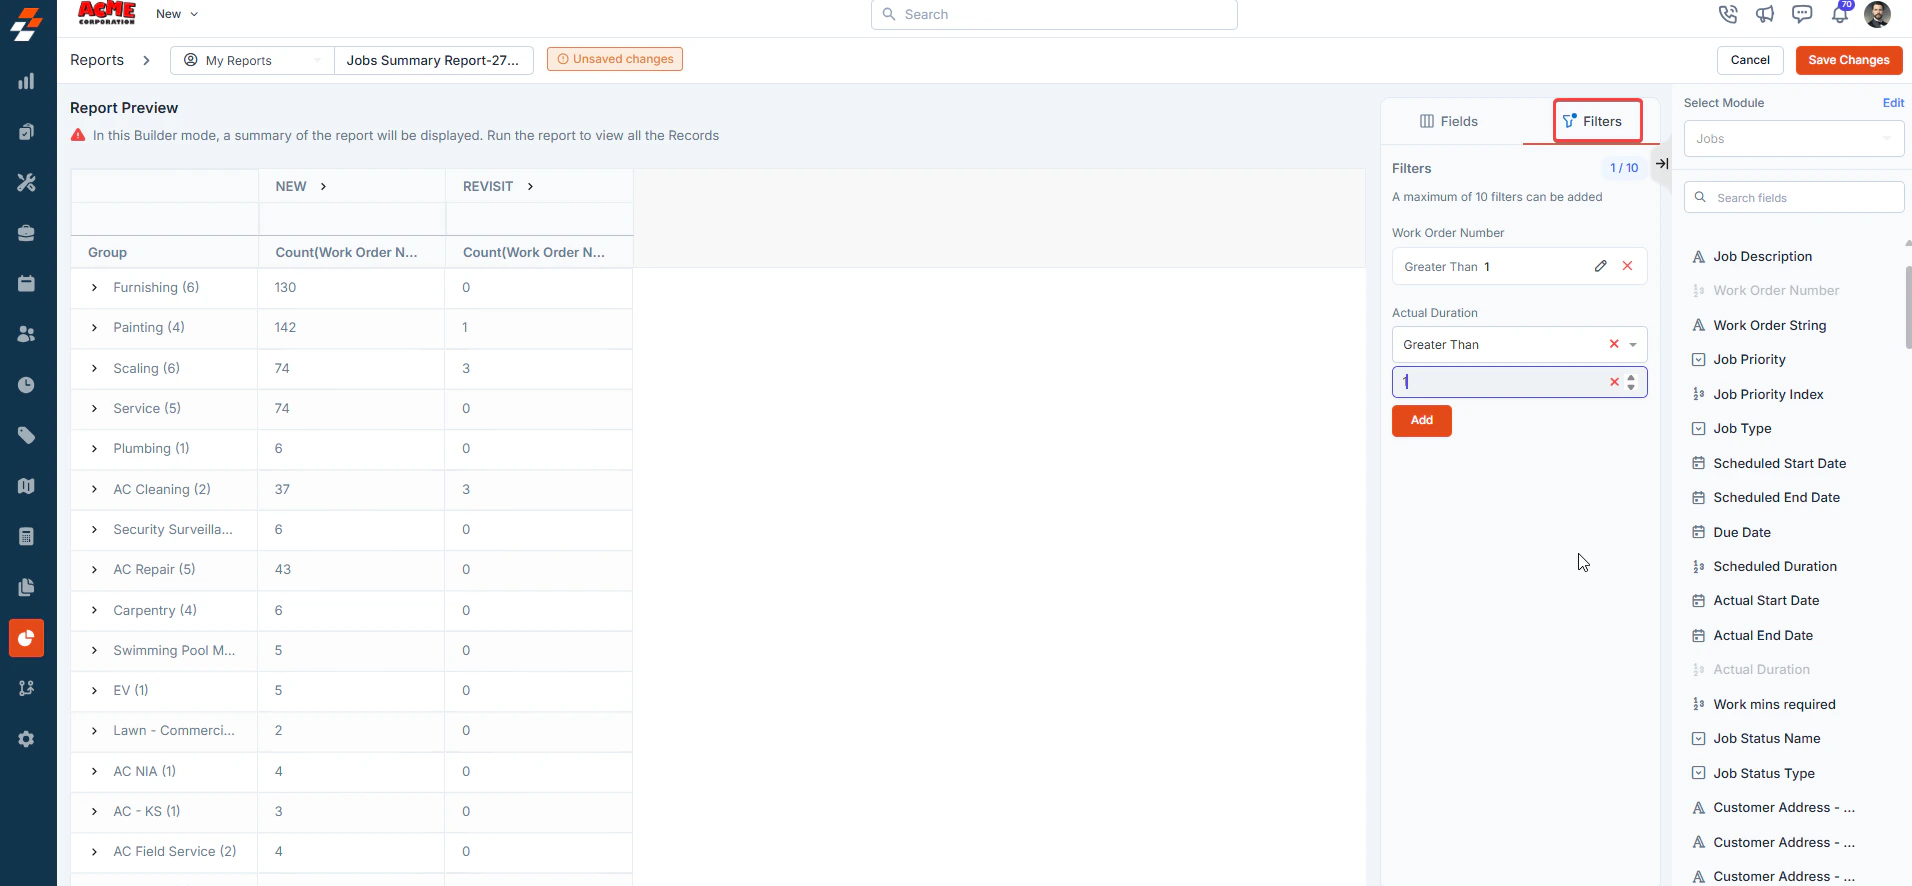
12. After selecting your fields, click the **Filter** tab > **Add** **Filter** to filter the report based on various attributes. For example, if you only want to see jobs completed within the last month or invoices over a specific amount, you can add those filters here. Note that you can apply up to **10 filters** to a summary report.
**Note:** You can reselect the modules by clicking the **Edit** button. However, updating the modules will reset the report.
11. You can rename column names and customize how each column behaves within the report. To know more, see [Configure Report Settings](/Reports/Detailed_report#configure-report-settings).
12. After selecting your fields, click the **Filter** tab > **Add** **Filter** to filter the report based on various attributes. For example, if you only want to see jobs completed within the last month or invoices over a specific amount, you can add those filters here. Note that you can apply up to **10 filters** to a summary report.
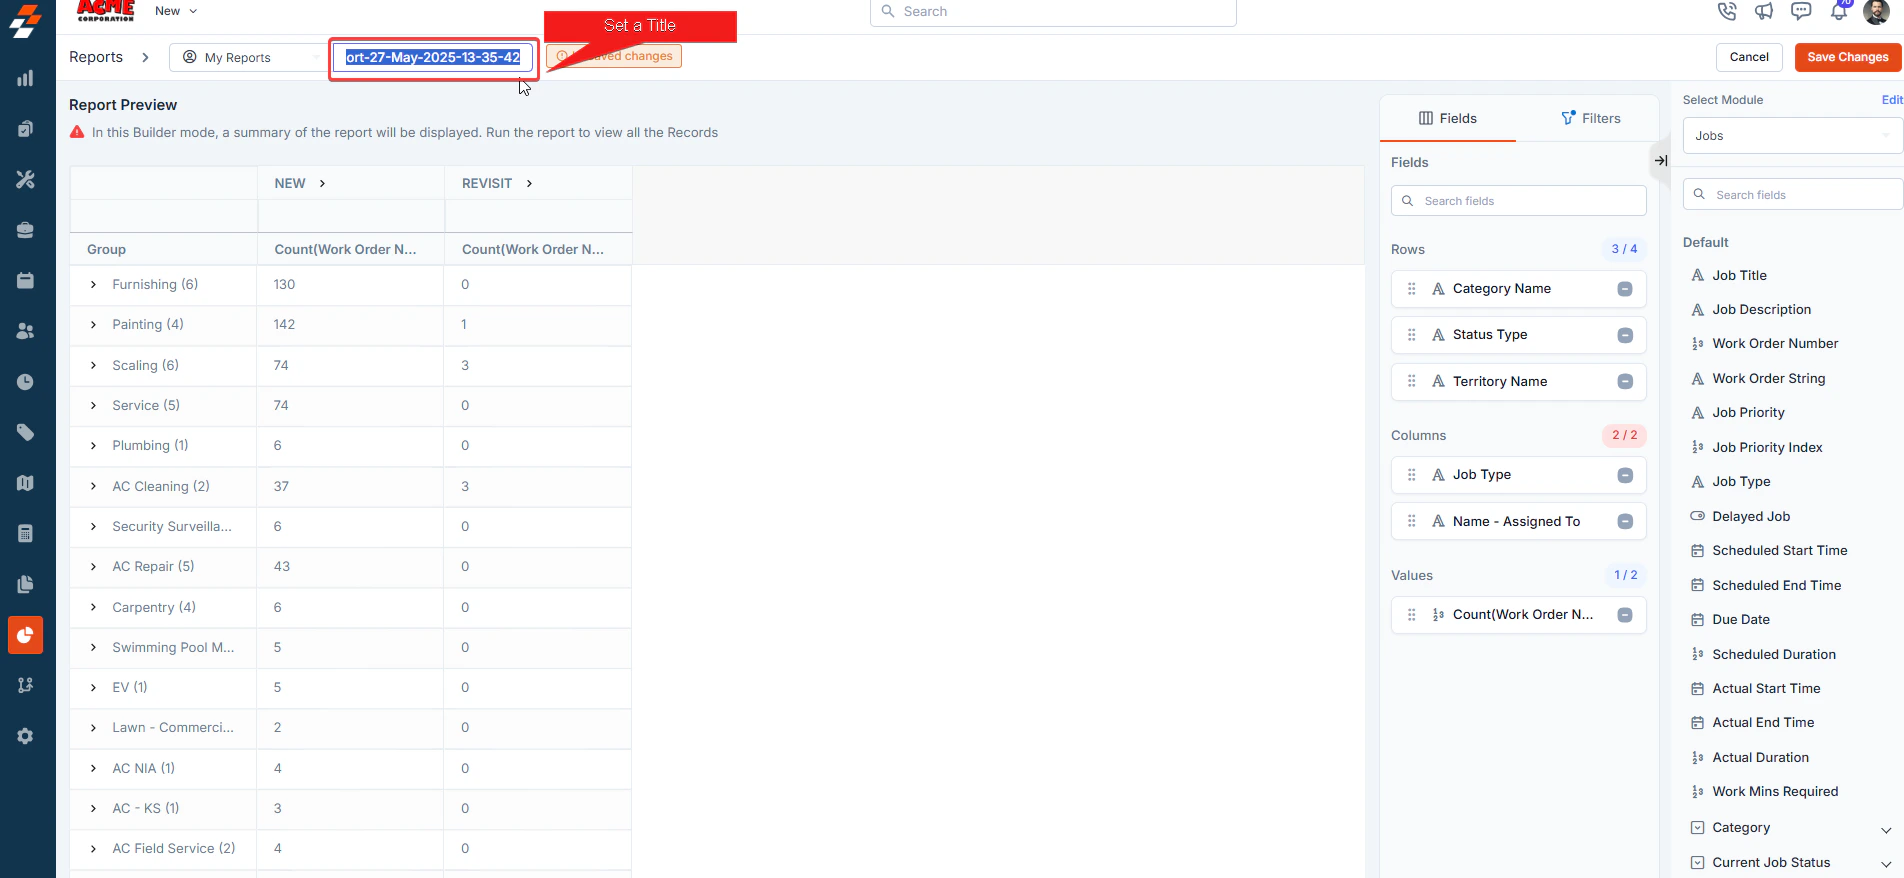
 13. Set a Title to save the newly created summary report. \*\*Note: \*\* The maximum allowed length for a report name is **50 characters.**
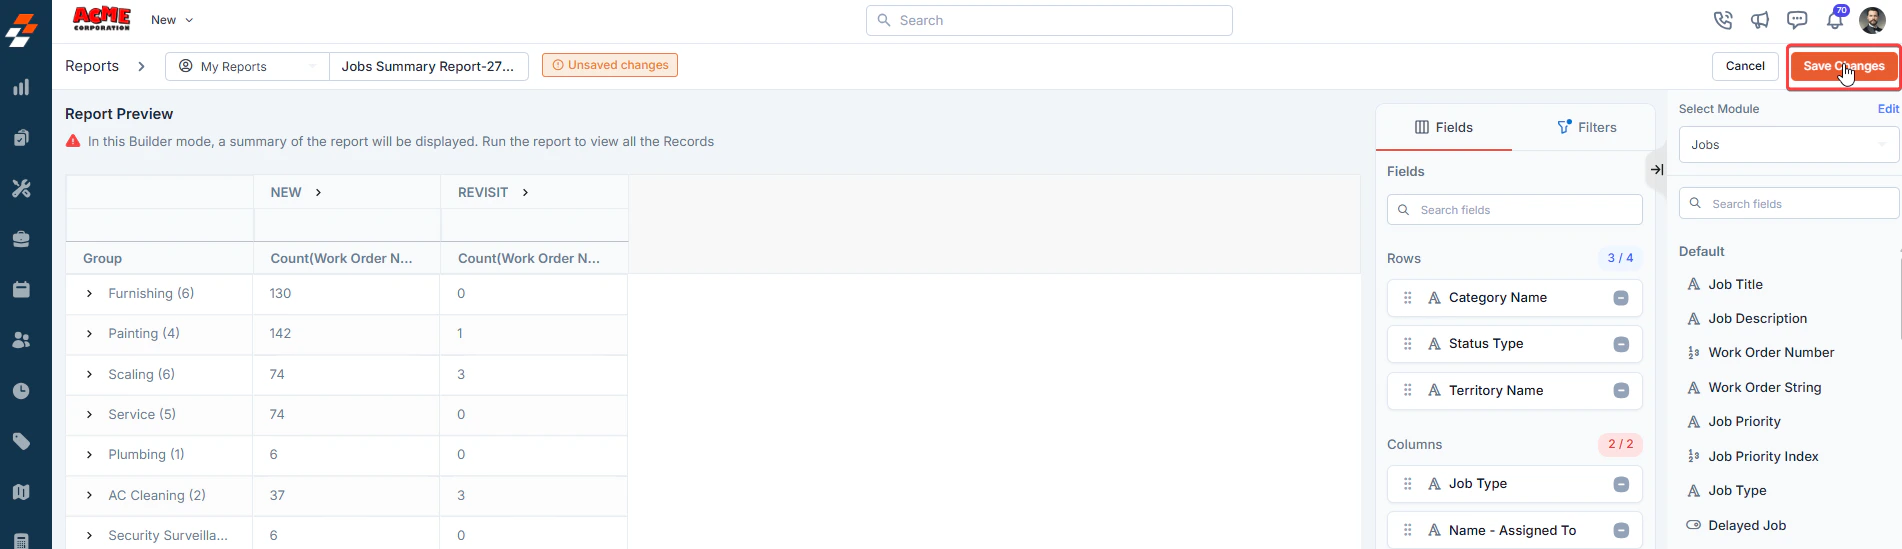
 14. Click **Save Changes**.
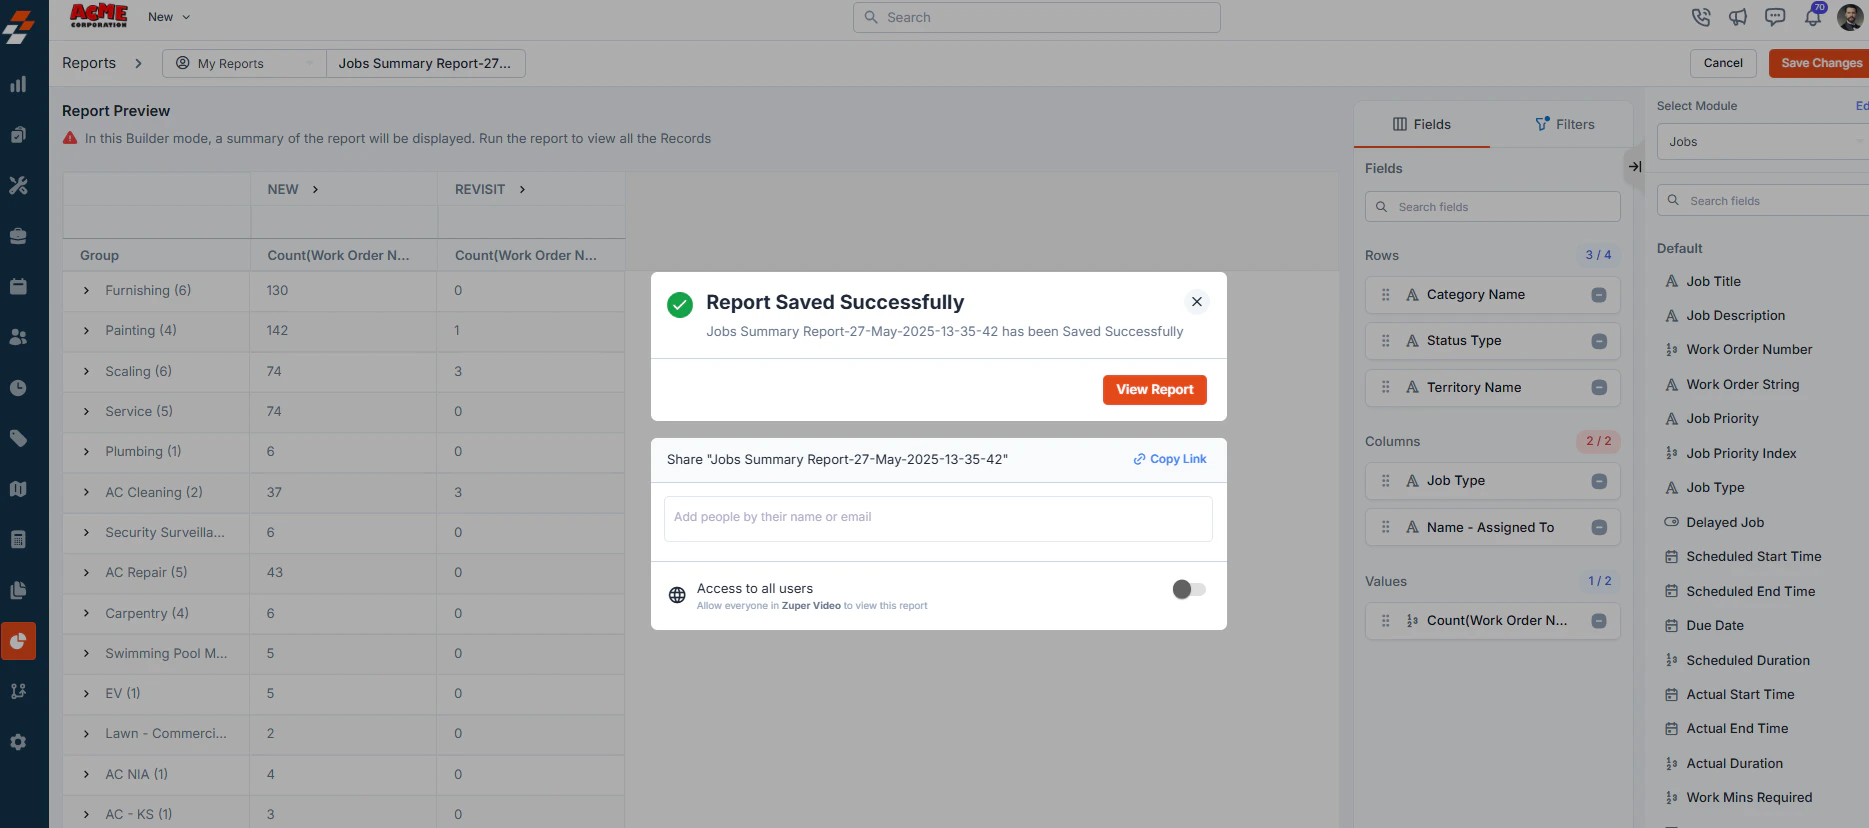
 15. Once the report is created, you can view it by clicking “**View Report**,” and you can also share it directly with your teams, customers, and so on through email. **To share**, add people by their name or email address and specify the permissions.
 16. You can also decide if you want to **schedule** the report. For example, you can set the report to generate automatically every week, month, or any custom interval you need. Scheduled reports will be delivered to your inbox or shared with team members according to your preferences. To learn more, see [Schedule Report](/Reports/Scheduling_report).